
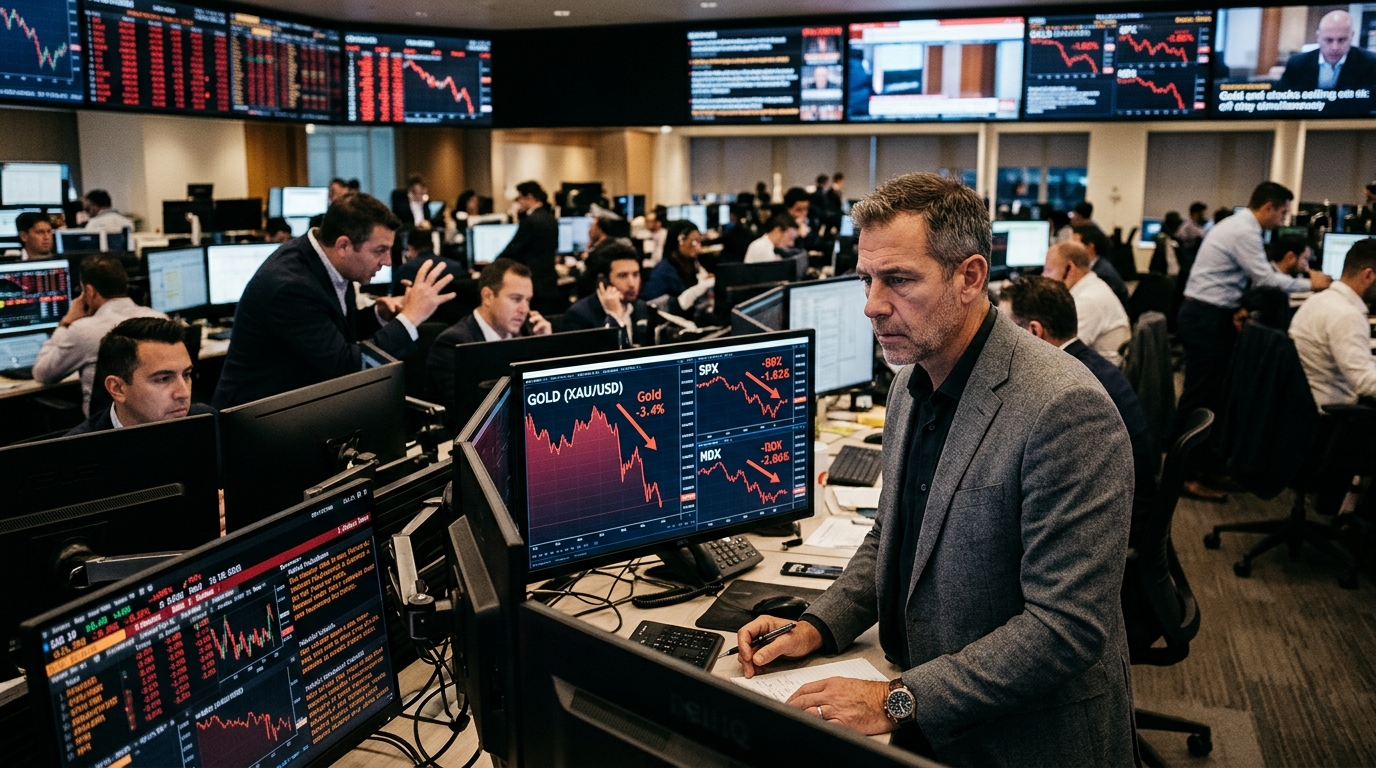
Friday delivered a clean, uncomfortable test for one of the most widely held assumptions in portfolio construction. Wall Street suffered a steep day of losses as the latest tech earnings reignited concerns that massive AI spending may not deliver the returns investors expect, with the Nasdaq dropping 2.86% and the S&P 500 falling 1.82%, each suffering their worst day since June. In that environment, gold was supposed to rise. It fell about 3.5% instead, pushing prices to their lowest level since October 6, 2025, when the precious metal touched an intraday low of $3,884.61.
Spot gold fell below $3,900 per ounce, its lowest level of 2026. That is not a rounding error. It is a month when the metal was supposed to be earning its allocation.
What Actually Moved
Gold is on track for a drop of about 6% in October, its worst showing for the month since 2008, when the global financial crisis was upending markets, and a second straight monthly decline. Silver slid below $50 an ounce for the first time since November 2025, compounding the damage across the metals complex. Miners took the worst of it: GDX closed down 5.21% on the day at $77.09, against a 52-week high of $117.18. Newmont posted record adjusted earnings and kept its production guidance, and its shares still fell about 4% anyway, because the market looked at the fourth quarter: costs up, gold down.
Why It Happened
Two forces combined. Third-quarter GDP growth beat expectations, while September PCE inflation rose 0.5% on the month and 3.6% year-on-year. Higher oil prices, driven by Middle East supply fears, keep real yields elevated, raising the cost of holding gold, which pays no yield. But the second force is the one worth watching more carefully.
The sharp fall in technology stock prices may have led to forced selling and margin calls, Commerzbank analysts said in a note. Because a large amount of leveraged money has piled into gold, a sharp fall in stocks triggers margin calls, and investors sell gold to raise cash. The hedge did not fail because gold changed. It failed because the investors holding it did.
What the Market May Be Missing
This is the key distinction, and most coverage has glossed over it. What gold tracked on Friday was the sell-off in AI equities: it was sold alongside risk assets, which points to a liquidity event rather than a rates trade. When the classic support conditions for gold, geopolitical stress, falling yields, a flat dollar, all hold, and the metal still drops, the signal is structural. The energy-to-gold transmission that held from March to September has broken. For most of the Iran war, higher oil meant higher yields and weaker gold. In October that chain came apart, and gold now trades with stocks.
HSBC concluded that gold may be a solid hedge against systemic risk in a multipolar world, but cannot be counted on to reduce short-term volatility. That is a meaningful concession from a bank that has historically supported the metal’s portfolio role.
Where It Shows Up
The damage runs deepest in the miners. About 92% of stocks in GDX trade below their 50-day moving average, the highest share since late July, after the figure jumped 80 percentage points in just 21 sessions. Some 90% sit below their 200-day average, a three-month high. That breadth collapse matters because miners are operationally leveraged to bullion: higher rates raise the cost of holding gold, which pays no interest, so higher oil reaches the miners twice, through their costs and through the rate channel. Silver, via XAG, faces a similar double exposure, as industrial demand softens alongside the tech sector.
Risks and Counterpoints
The bull case is not gone. Similar breadth setups in March and December 2024 preceded one-month GDX rallies of 21.5% and 15.4%, leading one market letter to conclude that the sell-off in gold miners is nearing exhaustion. A Reuters survey forecasts a median gold price of $4,495 for 2026 and $4,650 for 2027. Technical analyst Waleed Said at GivTrade said the path of least resistance remains lower, and he expects gold to eventually test support at $3,800 an ounce. Standard Chartered’s Suki Cooper placed the line to hold at $3,886.
What to Watch Next
The next price move could depend on the US midterm elections and the Federal Reserve’s December decision. December hike pricing has been elevated in recent days, according to desk research. If that number retreats, real yields soften, and the liquidity pressure on leveraged gold holders eases, the metal has room to recover. If payrolls surprise to the upside next Friday and hike odds firm further, $3,800 becomes a live target. The question investors need to answer before then is whether their gold position hedges their portfolio or simply tracks the thing they were trying to hedge against.