
October 5, 2026
Bonus Content: What Nippon Paint’s $1.35bn Bet on Southeast Asia Says for Copper

Patriots’ Most Trusted Gold Company
Since 2000, Gold Is Up 1,395%. The S&P Is Up 425%.
For U.S. savers age 55+ with $50,000 or more in an IRA, 401(k) or savings. Free of charge, no obligation to buy anything.
Same twenty-six years. Same two dot-com and 2008 collapses. Two very different lines on the chart.1,2 Most Americans have never seen them put side by side – and almost nobody was told they are allowed to hold the better-performing one inside a retirement account.
Two lines on the same chart
In December 1999 gold traded near $290 an ounce and the S&P 500 closed the year at 1,469. Since then gold has multiplied roughly fifteen times over. The S&P has multiplied about five.1,2
Be fair about the comparison: that S&P figure is the price index and does not include reinvested dividends, which would lift it meaningfully.2 Even allowing for that, the gap over a quarter century is not a rounding error.
The reason has less to do with gold than with the dollar. Over those same twenty-six years the money supply expanded, two crises were met with emergency printing, and the national debt crossed $40 trillion. Gold did not get more valuable so much as dollars got less so – and gold is the one asset that cannot be issued by anybody.
Right now gold sits below its January 2026 peak while the world’s central banks keep adding more than a thousand tons a year, and published bank targets still run from roughly $4,900 to $6,300.3,4 Those are opinions, not promises. But a quiet stretch is a better time to read up than a panic. Get the free 2026 Gold IRA Guide.
The free 2026 Gold IRA Guide walks through exactly how a rollover from an IRA, 401(k) or TSP works, which metals the IRS allows, how insured depository storage works, and the mistakes that cost retirees the most. It is free and it takes about thirty seconds to request.
Claim Your Free 2026 Gold IRA Guide →


Rock legend Ted Nugent and former White House Press Secretary Sean Spicer are official endorsers and clients of Bishop Gold Group. 10 years in business ⢠5-star rated on Trustpilot and Google ⢠Mint Authorized Dealer
Prefer to speak to someone? U.S.–based specialists, no pressure, no jargon.
Mon-Fri ⢠7am-5pm PT
Sources
1 LBMA gold price, 31 December 1999 ($290.25/oz) to September 2026. Past performance is not a guarantee of future results.
2 S&P 500 price index, 1,469.25 close on 31 December 1999 to 7,707 in September 2026 – a price-only comparison that excludes reinvested dividends, which would raise the S&P figure materially.
3 Published year-end gold price forecasts as reported 2026: Goldman Sachs, J.P. Morgan, UBS and Bank of America, spanning roughly $4,900–$6,300/oz. Analyst forecasts are opinions, not guarantees.
4 World Gold Council, Gold Demand Trends, annual central bank net purchases 2022-2024.
Past performance is not a guarantee of future results. Precious metals are volatile and can decline in value. This comparison is historical and is not a prediction or a recommendation to buy or sell any asset.
What Nippon Paint’s $1.35bn Bet on Southeast Asia Says for Copper
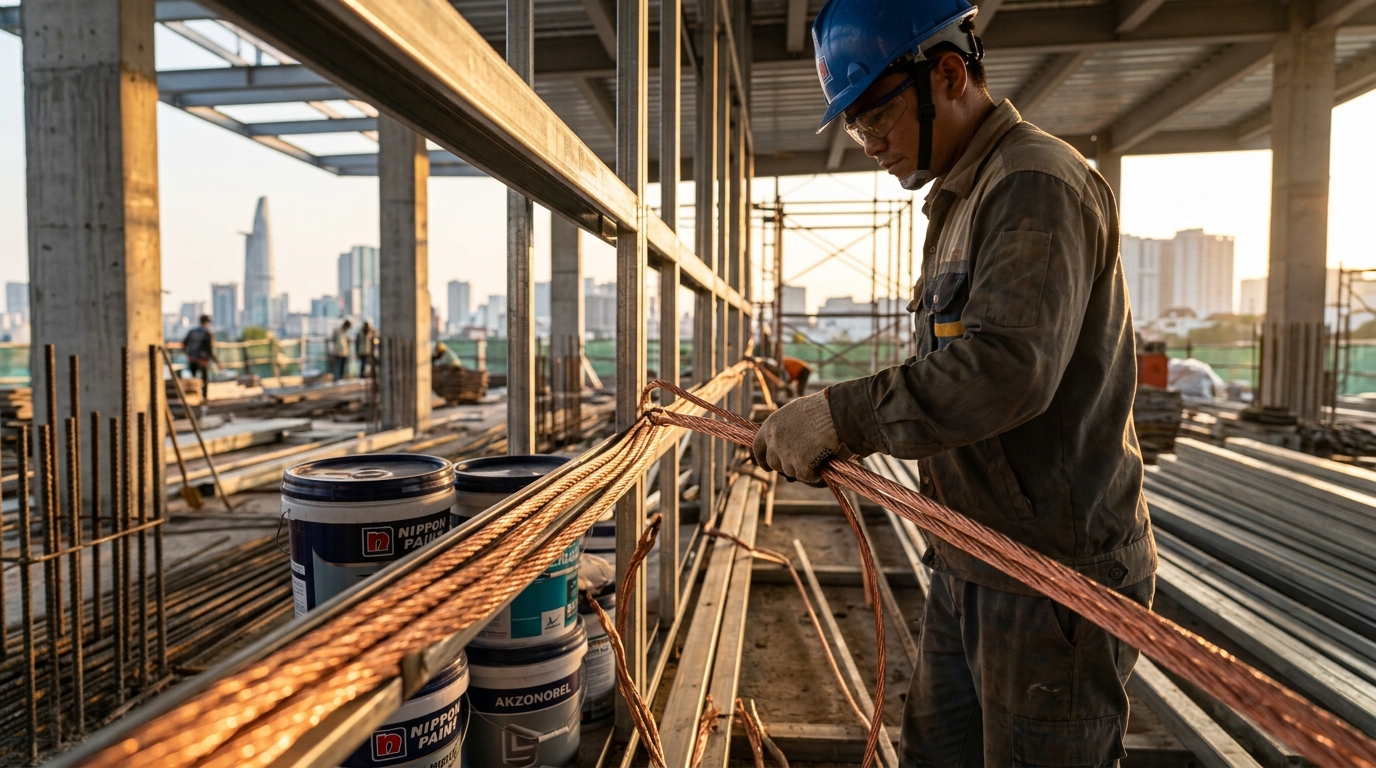
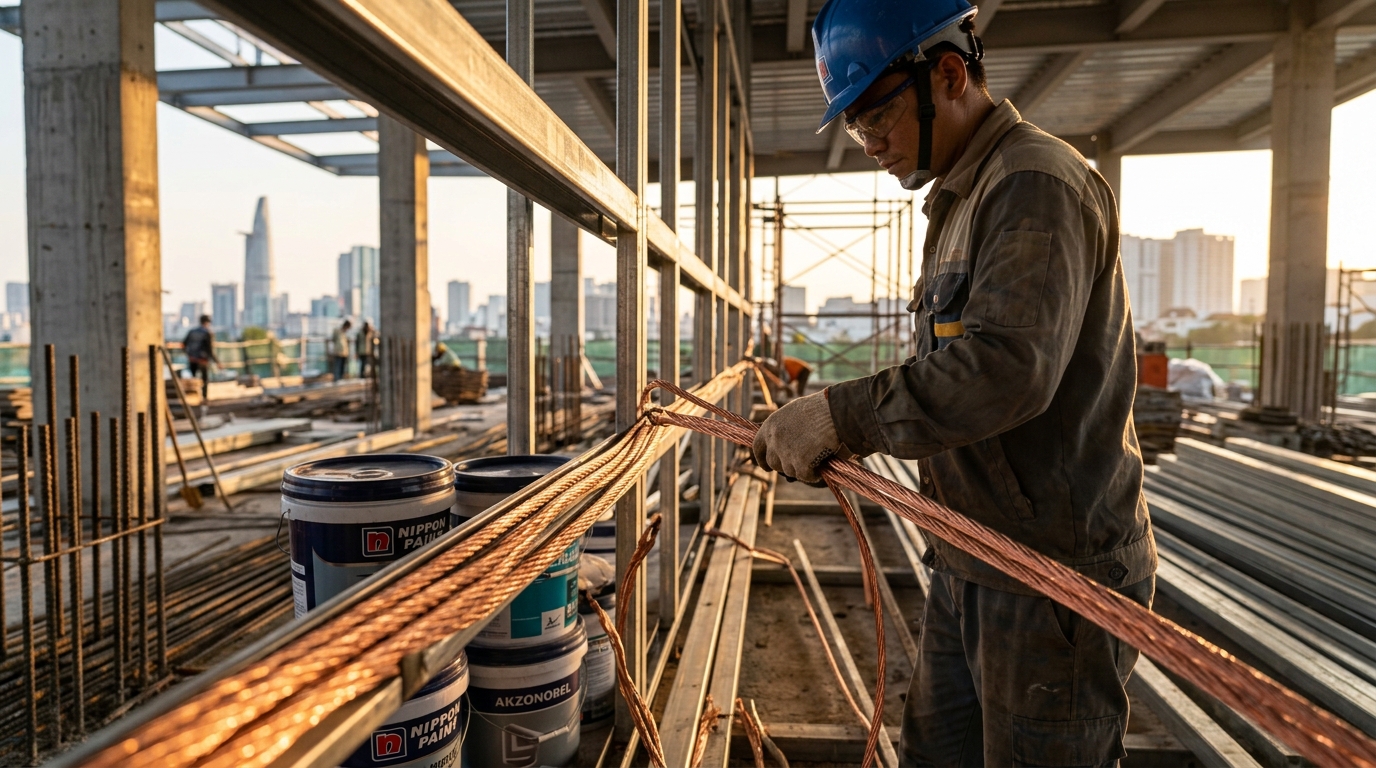
Nippon Paint Holdings agreed Monday to buy AkzoNobel’s decorative paints operations across Vietnam, Indonesia, Malaysia, Thailand, Singapore, Papua New Guinea, and Australia for $1.35 billion. The businesses generated $291 million in revenue and $65 million in EBITDA in 2025, at a margin of about 22%. Nippon, Japan’s leading paint and coatings group, had previously sought to acquire AkzoNobel itself alongside Sherwin-Williams and settled instead for this regional slice.
The price paid tells you something. AkzoNobel values the deal at 21 times 2025 EBITDA. Either way, Nippon is paying a premium for access to markets it considers structurally promising. That confidence matters more than the multiple for precious metals investors, because the raw-material chain underneath a paint can is longer than it looks.
Why Construction in Vietnam and Indonesia Is the Signal
Decorative paint does not move independently of walls, ceilings, and steel frames. It follows construction, and construction in these two markets is accelerating fast enough to show up in the industrial production data. Vietnam’s GDP grew 8.18% year-on-year in the first half of 2026, with the industry and construction sector expanding 9.81% and contributing nearly half of overall economic growth. More specifically, basic metal production in Vietnam grew 22.4% year-on-year through August 2026, the fastest of any major industrial sector.
Indonesia is running a parallel story. The new capital city project alone, Nusantara, is expected to require between 500,000 and 700,000 metric tons of steel in its first phase. In 2026, gross output of basic metals is expected to grow by 9% in Indonesia and 9% in Vietnam.
The metals feeding that construction are not exotic. Indonesia, Thailand, and Vietnam are experiencing fast-track growth in construction activity, with aluminum, zinc, and copper all critical inputs: aluminum for lightweight structures, zinc for corrosion-resistant coatings, copper throughout electrical systems. A paint company expanding aggressively into these markets is, in effect, underwriting the same demand thesis that copper and zinc bulls have been making for two years.
The Investment Thread
Nippon Paint’s willingness to pay a double-digit EBITDA multiple for regional paint exposure is the kind of corporate validation that often precedes sustained industrial-metals demand. Management teams in capital-intensive industries do not pay $1.35 billion for markets they expect to stall.
For precious metals investors, the most direct read-through is to silver, which carries a larger industrial component than gold. Copper-linked royalty positions and diversified base-metals streamers also benefit when Southeast Asian construction cycles extend. The less obvious read is on gold itself: sustained capital flows into emerging-market infrastructure tend to keep real rates in those economies anchored lower than in developed markets, which is a structural tailwind for reserve assets.
Risks to Monitor
The Indonesia close is expected separately in late 2026, while remaining markets wrap around mid-2027, so the construction signal is not yet fully confirmed by cash settlement. Regulatory delays could shift the timeline. A broader emerging-market credit tightening, or a sharp dollar rally that raises dollar-denominated debt costs for Vietnam and Indonesia, would cool construction spending faster than any government target anticipates.
Bottom Line
Nippon Paint did not spend $1.35 billion on Southeast Asian paint cans. It spent $1.35 billion on the conviction that Vietnam and Indonesia will keep building, and keep buying the steel, copper, and aluminum that goes into every structure those cans eventually cover. That is the same conviction industrial metals investors need to hold. When a strategic buyer prices it at 21 times EBITDA, the thesis gets a hard data point attached to it.