
September 18, 2026
11-Hour Options for Beginners: Get My “Rinse and Repeat” Income Trade Today – FREE
Bonus Content: Gold Near $4,385 After the Fed Hiked. Here Is What That Tells You.
New to Trading Options? Start Here
A Straightforward Options Strategy for Beginners:
Get the strategy + the “battle-tested” ticker today – at no cost

✓ How the 11-Hour Options strategy works – explained in plain English, from A to Z…
✓ The three things you need to start trading options today.
✓ Why this single-focused window may offer more potential than grinding through charts all day – and lets you actively trade while still living your life.
✓ A simple 3-question filter you can use to help evaluate a trade before placing it.
✓ The exact “rinse and repeat” ticker used in nearly 900 trades, with a reported 95.3% win rate – included to help you get started.
Send me my complimentary copy of the 11-Hour Options for Beginners guide
To your trading success,
Dave Aquino
Base Camp Trading
Gold Near $4,385 After the Fed Hiked. Here Is What That Tells You.
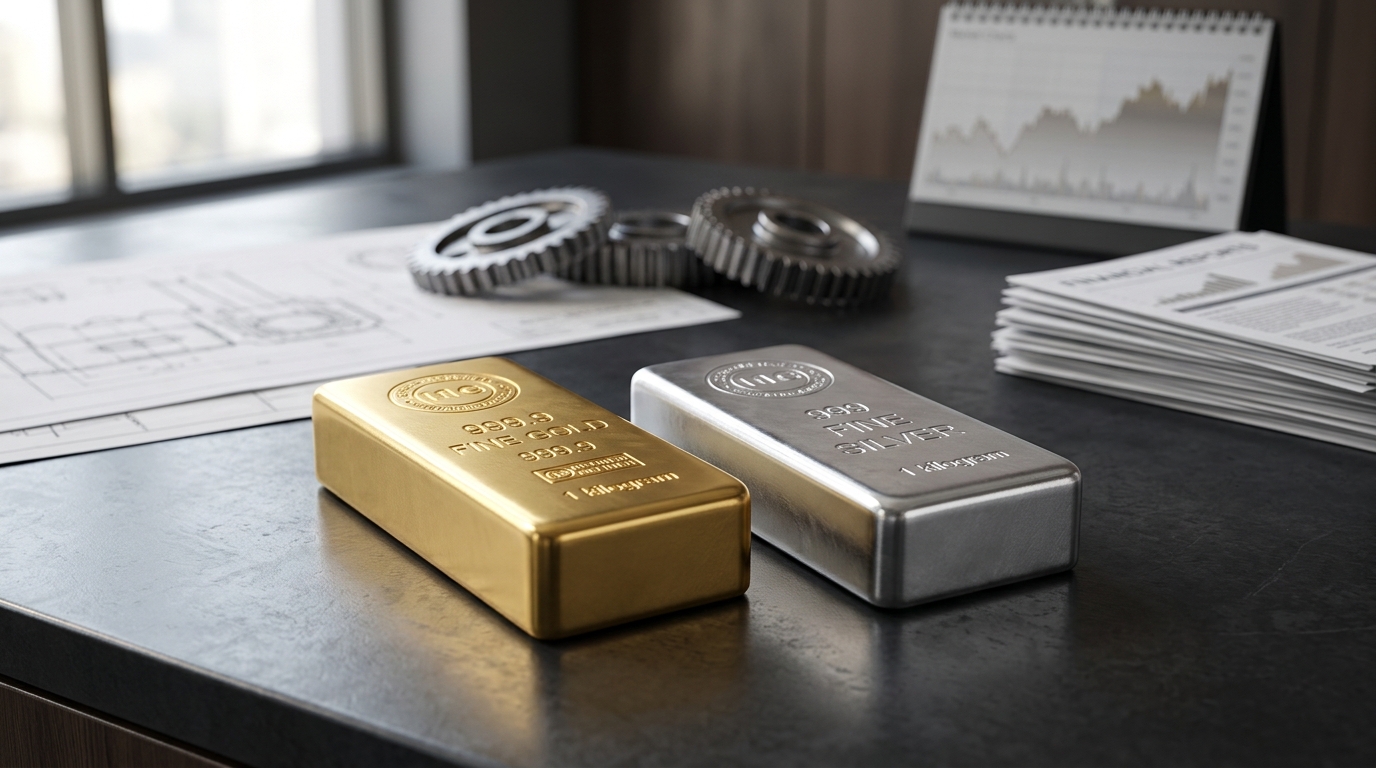
The Federal Reserve hiked rates for the first time since 2023 on September 16, and precious metals did the opposite of what the textbook said they should. The Fed raised its benchmark interest rate by 25 basis points to a target range of 3.75% to 4.00%. Gold sold off into the decision, then reversed hard. Gold rose toward $4,400 an ounce on Friday, extending gains from the previous session, supported by falling oil prices that eased inflation concerns and helped push bond yields lower. The metal that spent three consecutive weeks sliding into the FOMC snapped back almost immediately after it.
The proximate cause matters. Oil prices declined for a third consecutive session as Saudi Arabia worked to restore flows through its East-West pipeline. Cheaper oil pulled inflation expectations lower, which in turn pulled Treasury yields down. That is what freed gold. The 10-year Treasury yield pulled back and was last around 4.93% to 4.95%. Gold does not pay a coupon, so when the real cost of holding it falls, buyers return quickly.
What is worth pausing on is the depth of the drawdown that preceded this bounce. Gold reached an all-time high near $5,590 to $5,608 per ounce in late January 2026 before suffering a roughly 22% peak-to-trough drawdown, stabilising around $4,350 by mid-September 2026, still above every prior cycle high. From that vantage point, buyers near $4,385 today are paying roughly $1,200 less than the January peak. That is not a trivial discount, and it explains why institutional demand did not wait for clarity on the rate path. The World Gold Council reported central banks purchased 289 tonnes of gold in Q2 2026, up 62% year over year, buying aggressively into the quarter’s sharp price decline rather than retreating.
The more interesting development this week, though, is silver. Silver climbed 3% to around $65.50 an ounce on Thursday as investors reassessed their positions following the Fed’s first rate hike in three years, while the dollar retreated from a seven-week high. The gold-silver ratio compressed to roughly the mid-60s as silver outpaced gold, a shift that points to renewed physical interest in the white metal.
Silver at $65 is not the same asset it was at $20. The monetary bid is real, but the industrial bid is the structural story investors cannot dismiss. Silver entered 2026 with industrial demand projected around 650 million ounces, with industrial applications accounting for roughly 60% of total silver consumption. The Silver Institute has also pointed to consecutive supply deficits since 2021, with 2026 projected to be the sixth consecutive deficit year.
The complication: solar manufacturers are actively working to reduce silver content per panel precisely because high silver prices can make the metal a meaningful share of module costs. Bloomberg reported BloombergNEF estimates global silver demand from the solar industry is set to drop in 2026 for a second straight year. That is a genuine headwind. JPMorgan cut its Q4 2026 average forecast sharply to $63, citing weaker solar demand as the primary driver rather than Fed policy.
Risks to Monitor
Updated projections released Wednesday showed officials still see the possibility of another hike later this year. A second hike in October or December would almost certainly pressure both metals again. Markets are now pricing in roughly a coin-flip probability of a move in October. That is nearly a coin flip, and it keeps a ceiling on any sustained rally in gold while yields stay above 4.9%.
For GLD and SLV holders, the question is whether this week’s reversal is a genuine inflection or another relief trade inside a corrective structure. GDX miners, which sold off more than twice as fast as gold during the drawdown, carry higher beta on the way back up, but only if gold can hold above $4,300 on the next test.
Bottom Line
Gold near $4,385 is being bought because oil fell, not because the Fed turned dovish. That distinction matters. The hedge is working again, but on narrow terms: lower energy prices compressing yields, not a shift in the rate cycle. Silver above $65 carries a harder-to-read signal, one where factory demand and monetary demand are pulling in partially different directions. The cleaner read on silver’s durability is not the next Fed meeting. It is whether the sixth straight year of structural deficit survives the solar industry’s substitution campaign.