
Hey there, bargain hunter.
While everyone was watching Nvidia and the AI mega-caps, something unusual was happening in the forgotten corners of the market.
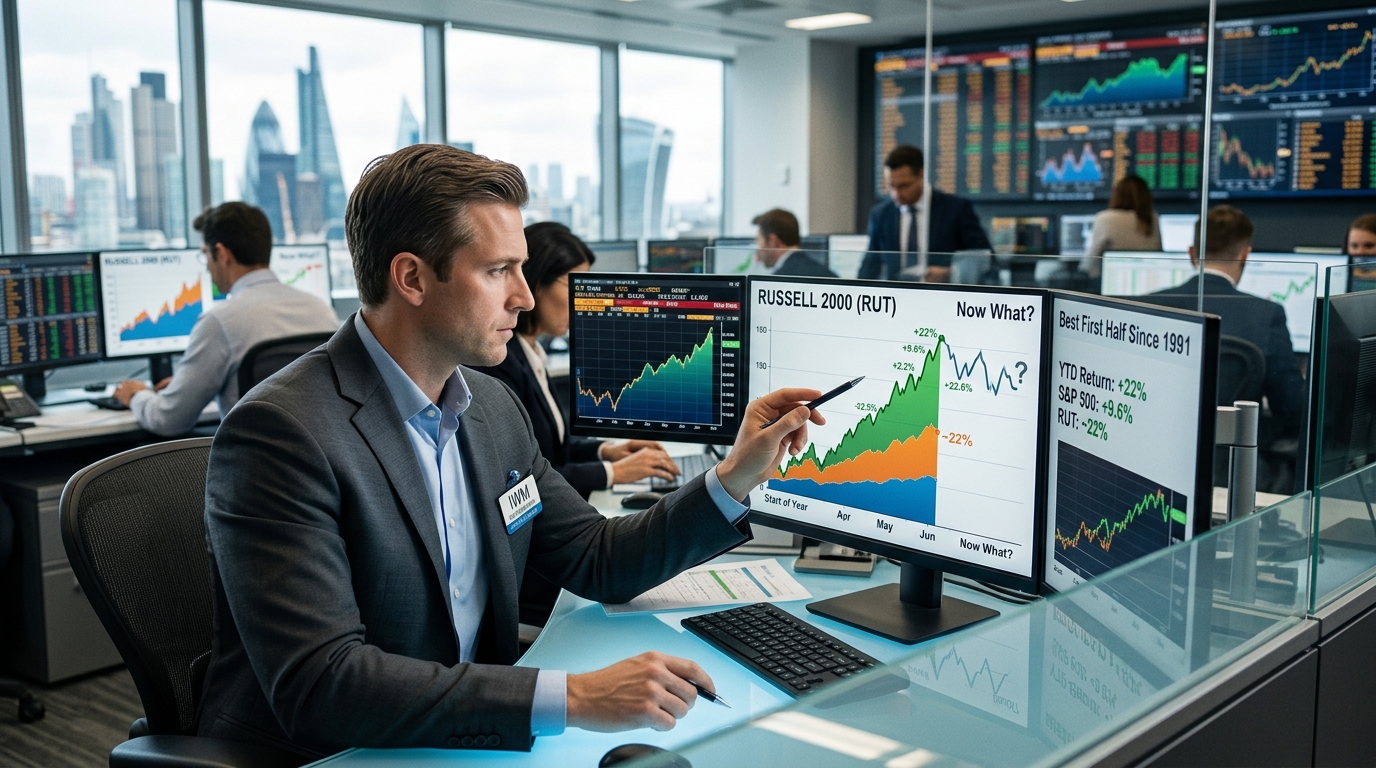
The Russell 2000 quietly put up its best first-half performance since 1991. Up about 22% through June 30th, outpacing the S&P 500’s 9.6% return. The iShares Russell 2000 ETF (IWM) closed June 30th at about $298.56.
That’s not a rotation. That’s a reset.
And the question right now, the one worth actually thinking through, is whether the second half looks anything like the first.
What Actually Drove This
The surface-level answer is AI. And that’s partly true. Chip-related names were a major driver of small-cap leadership in the first half.
But it’s not only AI.
Consensus earnings growth forecasts for Russell 2000 companies have climbed sharply for 2026. That upgrade reflects real operating leverage, not just momentum chasing.
That’s the structural part of the story that often gets missed in the headline.
The NFIB Divergence Worth Watching
Here’s where I’d push back a little on the pure bull case.
The NFIB Small Business Optimism Index fell to 95.3 in May 2026. Wall Street is enthusiastic about small-cap stocks. Main Street small business owners are not sending the same signal. That divergence between market price action and on-the-ground sentiment is not necessarily a reversal indicator, but it’s worth tracking. Earnings growth projections can look great right up until they don’t.
The Fed and the Rate Risk
This is the most important thing for anyone owning small caps into the second half.
The Fed’s target range for the federal funds rate has been 3.50% to 3.75% since June 18, 2026. Traders currently see roughly a 60% probability of a rate hike by the September 16, 2026 meeting. A quarter-point hike from here would reduce Russell 2000 operating earnings by approximately 2%, according to Bank of America estimates. That’s not fatal, but it directly compresses the relief trade that has been one of the core tailwinds for this entire move.
The 10-year Treasury is sitting around 4.5%. Cost of capital is not cheap for smaller companies even with the pause in place.
If the Fed cuts again by September, the post-reconstitution Russell 2000 is built to keep running, with heavier financial and cyclical weights. If it holds or hikes, those same weights become a liability.
What Happens After a 20%+ First Half
History gives some texture here. Since 1980, the Russell 2000 has gained more than 20% in the first half only four other times. In 1991, the last comparable year, the index continued higher, gaining 7.5% in Q3 and more than 13% for the full second half.
That pattern has held more often than not. But it also came in the context of declining rates and expanding economic conditions. The setup today has more uncertainty around rate direction than 1991 did at that point.
How to Think About Sizing
- IWM (Russell 2000 ETF): Broad exposure, 0.19% expense ratio. Carries unprofitable companies and rate-sensitive floaters. Best if you think the Fed eases again.
- IJR (S&P SmallCap 600 ETF): Screens for profitability. Better quality filter if you’re uncertain on rates.
- Sector tilt: Financials, industrials, and semiconductor-adjacent names led the first half. Biotech is another pocket worth watching, as AI tools are compressing drug discovery timelines in ways that could re-rate smaller biotech names.
The part of this trade that still looks cheap is the valuation discount to large caps. Small caps historically carry a premium, not a discount, to large caps on earnings growth expectations. That gap has only recently started to close.
Whether it closes the rest of the way in 2026 depends almost entirely on two things: whether those earnings growth estimates hold through Q3 reporting season, and whether the Fed is done or just pausing.
The answer to both questions arrives in the next sixty days.